Fluctuation electron microscopy analysis
Pixelated STEM can be used as a basis for fluctuation electron microscopy (FEM) measurements. By analyzing the variance amongst a large set of electron diffraction patterns, the medium-range order present in highly disordered materials can be statistically assessed. Pixstem’s FEM functionality is based on the methods outlined in:
T L Daulton, et al., Ultramicroscopy 110 (2010) 1279-1289.
Briefly, the input data set consists of a series of 2-D nanobeam electron diffraction patterns which is used to determine several measures of structural variance. These measures are:
- V-Omegak: normalized variance of the annular mean
- V-rk: mean of normalized variances of rings
- Vrek: normalized variance of ring ensemble
- Omega-Vi: normalized variance image
- Omega-Vk: Annular mean of the variance image
Performing the analysis
This example will use a test dataset that approximates a FEM-style signal.
The dataset is a PixelatedSTEM signals that consists of a 10x10 array of
electron diffraction patterns (100x100 pixels), each of which contain a central
bright disk, two rings of varying, intensity, and Poissonian noise. The test
data is loaded using pixstem.dummy_data.get_fem_signal().
>>> import pixstem.api as ps
>>> s = ps.dummy_data.get_fem_signal()
>>> fem_results = s.fem_analysis(centre_x=50, centre_y=50, show_progressbar=False)
Visualizing the results
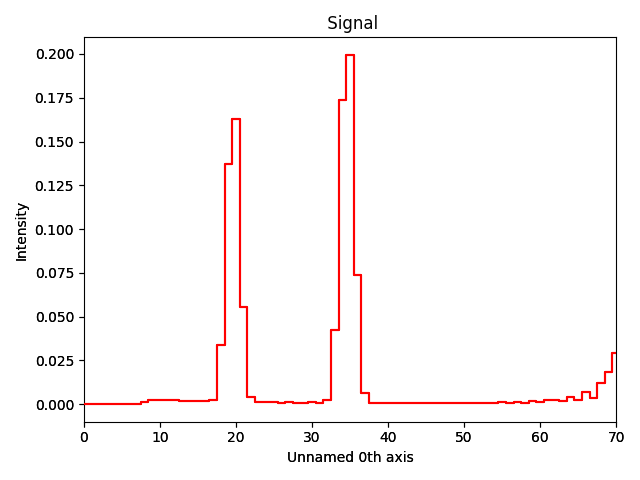
Each calculated statistical measure is stored as an independent signal in the results dictionary and can easily be plotted for visual inspection. For example:
>>> fem_results['V-Omegak'].plot()
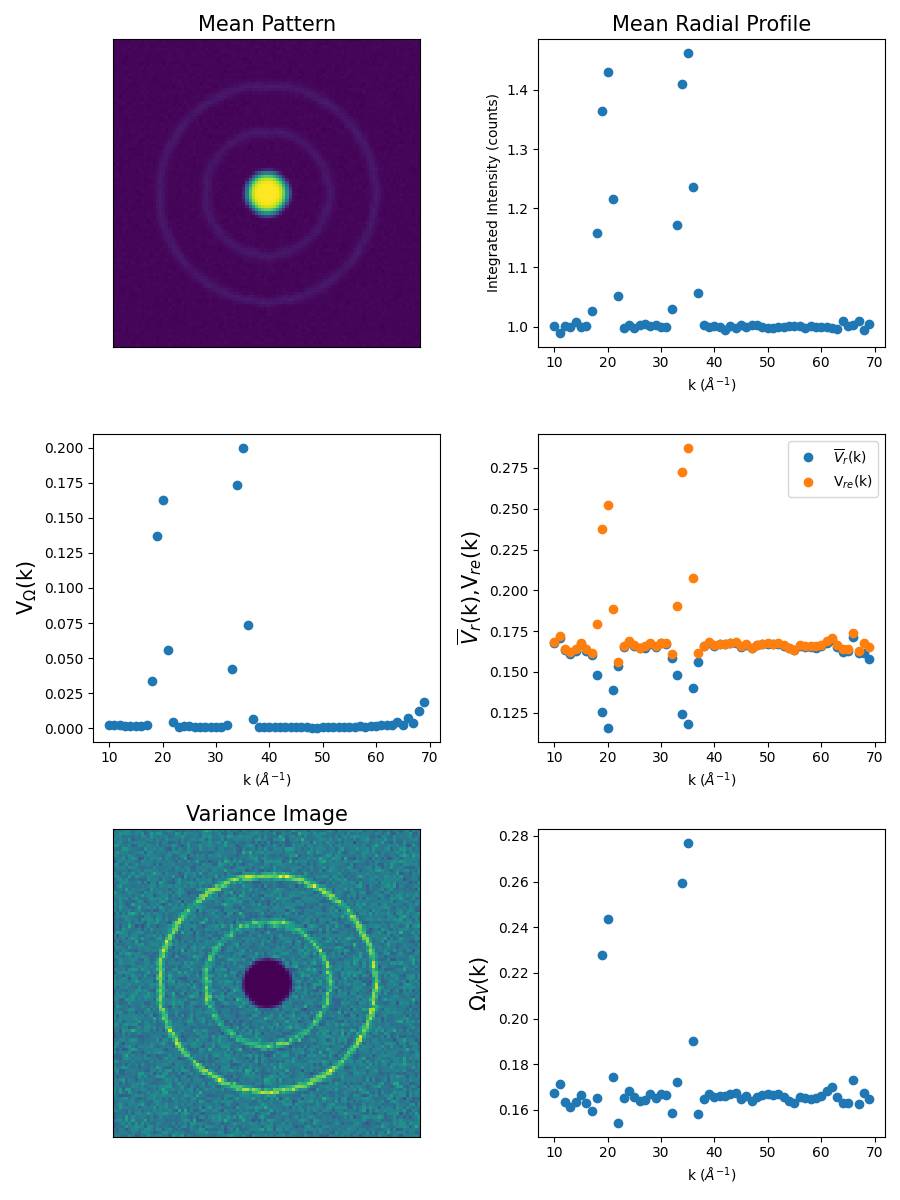
Alternatively, a plotting function: pixstem.fem_tools.plot_fem() is
available to plot all calculated measures in a single Matplotlib figure.
>>> import pixstem.fem_tools as ft
>>> fig = ft.plot_fem(s, fem_results)
>>> fig.savefig('FEM_Results.png')
Storing and recalling the results
Since each of the calculated statistical measures is a distinct PixelatedSTEM signal, they can each be saved manually the same as any other signal.
>>> fem_results['V-Omegak'].save('V-Omegak.hdf5')
For convenience, a dedicated function is also available: pixstem.fem_tools.save_fem().
This will create a separate folder and save all of the calculated measures
in separate HDF5 files with a common root name.
>>> ft.save_fem(fem_results, 'fem_results')
The saved files can be read back into memory using pixstem.fem_tools.load_fem().
This will return a dictionary consisting of the previously saved signals.
>>> fem_results_loaded = ft.load_fem('fem_results')